Presented at GopherCon 2026 in Seattle. The replay isn’t out yet.
Abstract
When a Go service misbehaves, where do you look? This talk walks through observability at three levels:
- Application: metrics, logs, and traces
- Go runtime: profiling with pprof
- Kernel: insights with eBPF
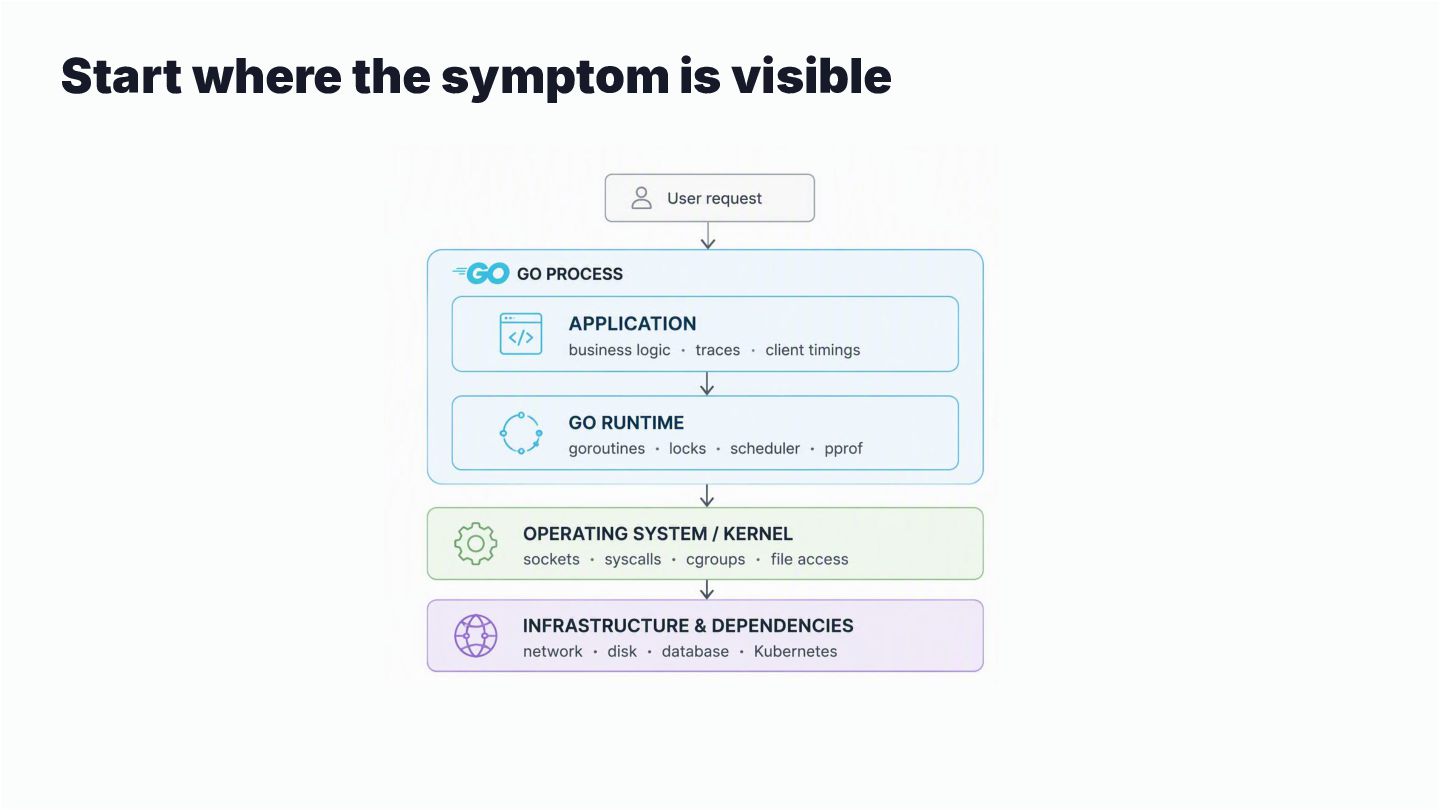
Each level is shown through practical debugging scenarios: goroutine leaks, context cancellation issues, CPU throttling, and off-CPU analysis. The code examples follow a performance problem from the application code, through the Go runtime, down to system-level constraints.